안녕하세요. LG CNS에서 보안관제 담당자 시절 "해킹 의심 IP를 종합적인 점수로 감지할 수 있을까?"에 대해 고민이 있었습니다.
아래 처럼 이벤트별 가중치를 줘서 종합점수 기반으로 서버 장애를 찾는 방법으로 하였습니다.
아래 frame을 토대로 다양한 데이터롤 로드하여 활용해 보세요!
<가설>
- IP별 이벤트 로그를 기반으로 종합점수가 높으면 해킹시도 의심 IP이다.
- 사용한 이벤트 파일 : 임의로 chatgpt 4.0을 이용해 1000개 log를 생성
- 엑셀 파일 형태
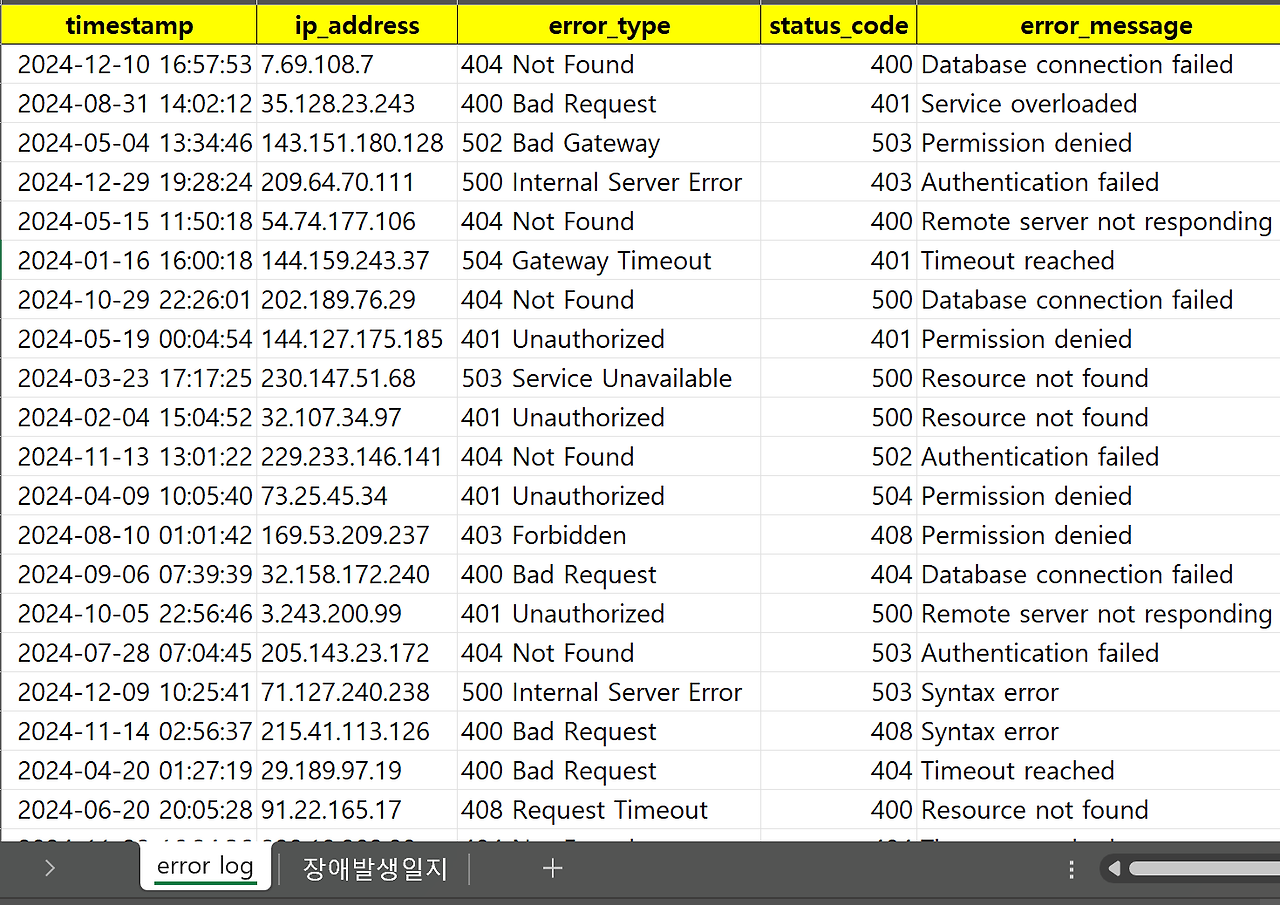
엑셀 파일
<찾은 해킹 의심 IP>
- 가짜로 임의로 만든 data이니 진짜 ip로 오인하여 차단 걸지 마세요!
전체 IP별 종합 점수:
         ip_address  total_score
0       73.25.45.34           10
1      66.182.6.193           15
2     62.244.181.17            9
3    242.194.93.183           13
4     29.153.51.137           17
..              ...          ...
65     173.18.92.63           13
66   135.22.103.151           17
67   214.181.76.188           14
68  233.112.250.187           16
69  120.175.229.185           18

[70 rows x 2 columns]

점수가 가장 높은 IP 상위 3개:
         ip_address  total_score
64   241.206.184.49           19
57     26.189.99.59           19
69  120.175.229.185           18
<가정>
- 전 글과 마찬가지로 장애 발생을 해킹 발생일로 해석
- 종합점수가 높은 top 3개 안에서 해킹이 발생
<결론>
- 만약 위와 같은 방법으로 찾은 ip가 실제 웹취약점 진단 IP or 실제 해킹시도 했던 IP이면 유효한 방법입니다.
-----------------------------------------------------------------사용 방법----------------------------------------------------------------------------------
1. 해킹(장애) 발생 2주(14일) 전까지의 로그를 전조 증상으로 세팅
mport pandas as pd
# 엑셀 파일 로드
file_path = r"엑셀 파일을 다운로드한 디렉토리로 하세요.\server_error_logs.xlsx"
excel_data = pd.ExcelFile(file_path)
# 장애발생일지 시트와 에러 로그 시트 로드
incident_df = pd.read_excel(excel_data, sheet_name='장애발생일지')
error_log_df = pd.read_excel(excel_data, sheet_name='error log')
# 장애 발생 timestamp 이전의 에러 로그를 전조 증상으로 분석
incident_df['timestamp'] = pd.to_datetime(incident_df['timestamp'])
error_log_df['timestamp'] = pd.to_datetime(error_log_df['timestamp'])
# 장애 발생 2주(14일) 전까지의 로그를 전조 증상으로 간주
time_delta = pd.Timedelta(weeks=2)
2. 가중치 부여 및 점수화하여 TOP 3개 IP 찾
# 에러 타입과 에러 메시지에 대해 가중치를 부여하는 점수 테이블
error_type_scores = {
"500 Internal Server Error": 10,
"502 Bad Gateway": 8,
"503 Service Unavailable": 9,
"504 Gateway Timeout": 7,
"400 Bad Request": 5,
"401 Unauthorized": 4,
"403 Forbidden": 6,
"404 Not Found": 3,
"408 Request Timeout": 4
}
error_message_scores = {
"Syntax error": 8,
"Authentication failed": 6,
"Resource not found": 4,
"Timeout reached": 7,
"Service overloaded": 9,
"Database connection failed": 10,
"Invalid request format": 5,
"Permission denied": 6,
"Remote server not responding": 8
}
# IP별 점수 기록용 딕셔너리
ip_scores = {}
# 각 장애 발생에 대해 해당 시간대의 전조 증상 에러 로그 분석 및 점수 계산
for index, incident in incident_df.iterrows():
incident_time = incident['timestamp']
# 장애 발생 2주 전 로그 필터링
pre_incident_logs = error_log_df[(error_log_df['timestamp'] >= incident_time - time_delta) &
(error_log_df['timestamp'] < incident_time)]
# 전조 증상 에러 로그에 대해 점수 계산
for _, log in pre_incident_logs.iterrows():
error_type = log['error_type']
error_message = log['error_message']
ip_address = log['ip_address']
# 에러 타입과 에러 메시지에 대한 점수를 합산
type_score = error_type_scores.get(error_type, 0)
message_score = error_message_scores.get(error_message, 0)
total_score = type_score + message_score
# IP 주소별 점수 합산
if ip_address in ip_scores:
ip_scores[ip_address] += total_score
else:
ip_scores[ip_address] = total_score
# IP별 점수 데이터프레임 생성
df_ip_scores = pd.DataFrame(list(ip_scores.items()), columns=['ip_address', 'total_score'])
# 전체 IP별 종합 점수 출력
print(f"전체 IP별 종합 점수:\n{df_ip_scores}")
# 점수가 높은 IP 상위 3개 출력
top_3_ips = df_ip_scores.sort_values(by='total_score', ascending=False).head(3)
print(f"\n점수가 가장 높은 IP 상위 3개:\n{top_3_ips}")
감사합니다.
'ML' 카테고리의 다른 글
| AI로 장애 예방하기(feat. Transformer Bert) (0) | 2024.10.28 |
|---|---|
| ML(Machine Learning)으로 서버 장애 사전감지하기(feat. 랜덤포레스트,KFold 교차검증) (0) | 2024.10.25 |
| 서버 장애 사전 감지하기(feat. 파이썬으로 통계분석) (0) | 2024.10.24 |
| 사진첩에서 원하는 이미지 찾기(feat. transformer 사용, model : ViT) (0) | 2024.10.23 |
| 법률 전문가 솔루션 만들기(feat. OpenAI ChatGPT4.0 API) (0) | 2024.10.22 |