안녕하세요. LG CNS에서 서버admin시절 "Deel Learning로 중요한 로그만 따로 알아서 찾아줄 수 없을까?"에 대해
고민이 있었습니다.
이전 https://funscientist.tistory.com/48 글에서는 교차검증으로 장애를 사전판별할 수 있는 방법을 찾으려는 시도였다면
이번엔 DL을 이용하여 텍스트 감정분석과 같은 원리로 중요도를 찾는 것입니다.
아래 frame을 토대로 다양한 data를 load하여 활용해 보세요!
<가설>
- 장애메세지는 문장의 의미를 해석하여 중요한 메세지를 찾을 수 있다.
- Bert 사용이유 : 대규모 신경망인 Transformer 아키텍처에 기초, 로컬에서 수행하기에 민감한 정보가 올라가지 않는다.
(chatgpt처럼 온라인에 올라가지 않는다.)
- 사용한 이벤트 파일 : BERT로 1000개 log를 무작위로 생성(inform성, 중요메세지 등)

<결과값>
Messages with Normalized Importance Score >= 0.9:
               timestamp                                      message_score  \
6    2024-10-28 15:26:58  System checked connection failure | IMPORTANCE...
9    2024-10-28 15:37:06  System checked connection failure | IMPORTANCE...
16   2024-10-28 16:13:50  File checked unexpected shutdown | IMPORTANCE_...
22   2024-10-28 16:47:55  Service completed permission denied | IMPORTAN...
36   2024-10-28 17:58:34  Application attempted unauthorized access | IM...
..                   ...                                                ...
934  2024-10-31 22:18:20  Service reached unexpected shutdown | IMPORTAN...
942  2024-10-31 22:58:02  CPU attempted connection failure | IMPORTANCE_...
946  2024-10-31 23:18:31  Service detected connection failure | IMPORTAN...
973  2024-11-01 01:24:20  Network attempted permission denied | IMPORTAN...
993  2024-11-01 03:18:48  Memory checked unexpected shutdown | IMPORTANC...

     normalized_importance_score
6                       0.919181
9                       0.919181
16                      0.945459
22                      0.908725
36                      0.909749
..                           ...
934                     0.955072
942                     0.966600
946                     0.945384
973                     0.922943
993                     0.945825

[66 rows x 3 columns]
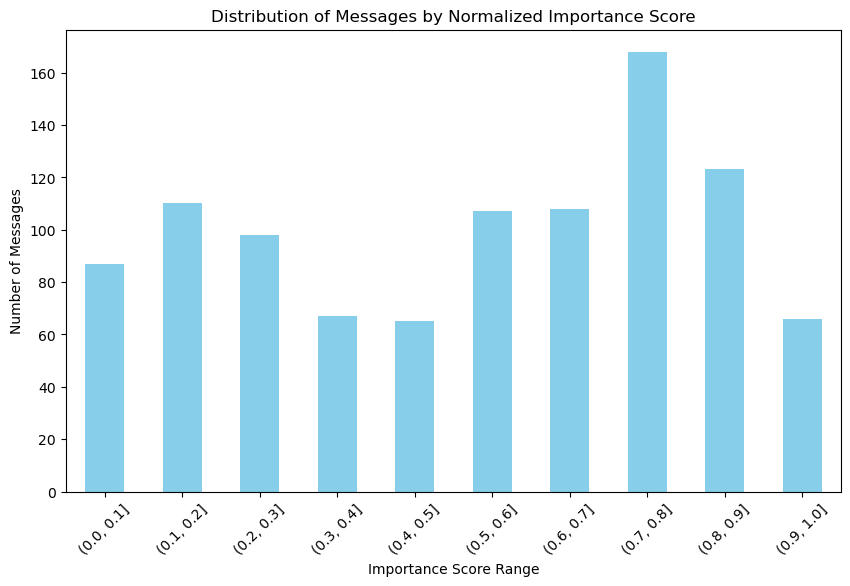
<결론>
- 표준화한 상위 10% 메세지는 중요한 메세지들로 보인다.
<개별 테스트>
- 개별로 txt log파일을 아래 코드를 이용하여 수행해서 정말 상위 10%가 중요한 message였는지 확인해보세요.
<웹 colab에서 별도 설치 없이 하는 방법>
-----------------------------------------------------------------사용 code----------------------------------------------------------------------------------
1. 로그파일 로드, BERT모델 기반 토크나이저로 중요도 계산
import pandas as pd
import torch
from transformers import BertTokenizer, BertForSequenceClassification
from torch.nn.functional import softmax
import matplotlib.pyplot as plt
from sklearn.preprocessing import MinMaxScaler
# 파일 로드 - 전체 경로 사용
file_path = r"C:파일업로드한 절대 경로 입력하세요.\system_logs.txt"
data = pd.read_table(file_path, names=["timestamp", "message_score"], engine="python")
# BERT 모델 및 토크나이저 로드
model_name = "nlptown/bert-base-multilingual-uncased-sentiment"
tokenizer = BertTokenizer.from_pretrained(model_name)
model = BertForSequenceClassification.from_pretrained(model_name)
# 중요도 점수 계산 함수
def calculate_importance_score(text):
inputs = tokenizer(text, return_tensors="pt", truncation=True, padding=True)
with torch.no_grad():
outputs = model(**inputs)
scores = softmax(outputs.logits, dim=1)
max_score = torch.max(scores).item() # 가장 높은 클래스 점수를 가져와서 중요도로 사용
return max_score
# 각 메시지에 대해 중요도 점수 계산
data['importance_score'] = data['message_score'].apply(calculate_importance_score)
2. 표준화 및 중요메세지(0.9이상 가정), 시각화
# 중요도를 0~1 범위로 표준화
scaler = MinMaxScaler(feature_range=(0, 1))
data['normalized_importance_score'] = scaler.fit_transform(data[['importance_score']])
# 중요도 점수가 0.9 이상인 메시지 필터링 및 출력
important_messages = data[data['normalized_importance_score'] >= 0.9]
print("\nMessages with Normalized Importance Score >= 0.9:")
print(important_messages[['timestamp', 'message_score', 'normalized_importance_score']])
# 중요도 구간별 메시지 수 시각화
bins = [0.1 * i for i in range(11)]
data['score_bin'] = pd.cut(data['normalized_importance_score'], bins=bins)
score_distribution = data['score_bin'].value_counts().sort_index()
# 차트 생성
plt.figure(figsize=(10, 6))
score_distribution.plot(kind='bar', color='skyblue')
plt.xlabel('Importance Score Range')
plt.ylabel('Number of Messages')
plt.title('Distribution of Messages by Normalized Importance Score')
plt.xticks(rotation=45)
plt.show()
감사합니다.
'ML' 카테고리의 다른 글
| (AI_신경망 활용)보안 이벤트 로그 분류-비정상(해킹시도) / 정상 (0) | 2024.11.04 |
|---|---|
| 보안log기반 SIEM내 중요 이벤트 가중치 계산(with stats 모델) (0) | 2024.11.04 |
| ML(Machine Learning)으로 서버 장애 사전감지하기(feat. 랜덤포레스트,KFold 교차검증) (0) | 2024.10.25 |
| 해킹 의심 IP 찾기(feat. 파이썬 통계) (0) | 2024.10.24 |
| 서버 장애 사전 감지하기(feat. 파이썬으로 통계분석) (0) | 2024.10.24 |