안녕하세요. 서버admin시절 "ML로 서버 장애를 사전감지할 수 있을까?"에 대해 고민이 있었습니다.
이전 https://funscientist.tistory.com/46 글에서는 가중치를 미리 임의로 입력하여 임계값을 찾는 방식이었다면
이번엔 ML을 이용하여 최대한 여러 가정을 없애고 분석하는 방식으로 수정해 보았습니다.
아래 frame을 토대로 다양한 data를 load하여 활용해 보세요!
<가설>
- 장애는 비선형적으로 일어나며, 장애 발생 한달전 이벤트를 ML(KFold교차검증)을 통해 사전에 감지할 수 있다.
- KFold 사용이유 : 다른 방식의 교차검증시 과적합이 발생하여 모델이 무의미
- 사용한 이벤트 파일 : 임의로 chatgpt 4.0을 이용해 1000개 log를 생성
- 엑셀 파일 형태

<찾은 종합 임계값>
교차 검증 AUC 점수: [nan nan]
평균 교차 검증 AUC 점수: nan
테스트 세트 AUC 점수: 0.5
<Figure size 1000x600 with 0 Axes>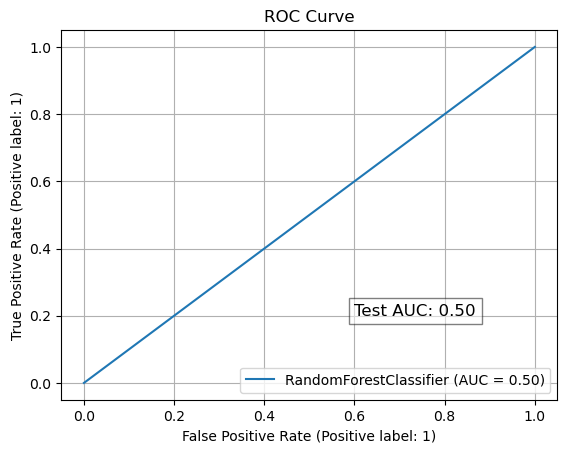
<결론>
- Test AUC가 0.5로 위 모델이 무작위로 예측하며 예측을 못한다는 의미
<원인>
- 임의로 만든 data라 양질의 실제 log data가 아니어서 예측 자체가 의미 없음
- 실제 data로 수행시에 Test AUC값이 0.8이상이 나온다면, 정말 예측이 가능(장애발생 전에 일정한 이벤트가 발생)
-----------------------------------------------------------------사용 code----------------------------------------------------------------------------------
1. 장애 발생 1달 전까지의 로그를 전조 증상으로 세팅
import pandas as pd
from sklearn.feature_extraction.text import TfidfVectorizer
from sklearn.ensemble import RandomForestClassifier
from sklearn.preprocessing import StandardScaler
from sklearn.metrics import roc_auc_score, RocCurveDisplay
from sklearn.model_selection import cross_val_score, KFold, train_test_split
import matplotlib.pyplot as plt
# 엑셀 파일 로드
file_path = r"C:\본인 파일의 경로 설정\server_error_logs_2.xlsx"
excel_data = pd.ExcelFile(file_path)
# 장애발생일지 시트와 에러 로그 시트 로드
incident_df = pd.read_excel(excel_data, sheet_name='장애발생일지')
error_log_df = pd.read_excel(excel_data, sheet_name='error log')
# 장애 발생 timestamp 이전의 에러 로그를 전조 증상으로 분석
incident_df['timestamp'] = pd.to_datetime(incident_df['timestamp'])
error_log_df['timestamp'] = pd.to_datetime(error_log_df['timestamp'])
# 장애 발생 1달(30일) 전까지의 로그를 전조 증상으로 간주
time_delta = pd.Timedelta(days=30)
# 각 장애 발생에 대해 해당 시간대의 전조 증상 에러 로그 분석
incident_scores = []
for index, incident in incident_df.iterrows():
incident_time = incident['timestamp']
# 장애 발생 1달 전 로그 필터링
pre_incident_logs = error_log_df[(error_log_df['timestamp'] >= incident_time - time_delta) &
(error_log_df['timestamp'] < incident_time)]
# 전조 증상 에러 로그를 하나의 문자열로 병합
combined_errors = " ".join(pre_incident_logs['error_message'])
incident_scores.append({
"incident_time": incident_time,
"combined_errors": combined_errors,
"incident_occurred": 1 # 장애 발생 여부
})
# 장애가 발생하지 않은 데이터 추가
non_incident_scores = []
for index, incident in incident_df.iterrows():
incident_time = incident['timestamp']
# 장애 발생하지 않은 시점의 로그 필터링
pre_non_incident_logs = error_log_df[(error_log_df['timestamp'] >= incident_time - time_delta*2) &
(error_log_df['timestamp'] < incident_time - time_delta)]
# 전조 증상 에러 로그를 하나의 문자열로 병합
combined_errors = " ".join(pre_non_incident_logs['error_message'])
non_incident_scores.append({
"incident_time": incident_time,
"combined_errors": combined_errors,
"incident_occurred": 0 # 장애 발생하지 않음
})
# 장애 발생 데이터와 비발생 데이터를 결합
df_incident_scores = pd.DataFrame(incident_scores)
df_non_incident_scores = pd.DataFrame(non_incident_scores)
df_all_scores = pd.concat([df_incident_scores, df_non_incident_scores], ignore_index=True)
2. 임베딩, KFold로 교차검증, RoC Curv 생성
# TF-IDF를 사용하여 에러 메시지를 벡터화
tfidf_vectorizer = TfidfVectorizer(max_features=100)
X = tfidf_vectorizer.fit_transform(df_all_scores['combined_errors']).toarray()
# 장애 발생 여부를 종속 변수로 설정
y = df_all_scores['incident_occurred']
# 데이터 표준화
scaler = StandardScaler()
X_scaled = scaler.fit_transform(X)
# 데이터를 훈련/테스트 세트로 분할 (과적합 방지를 위해)
X_train, X_test, y_train, y_test = train_test_split(X_scaled, y, test_size=0.3, random_state=42)
# 교차 검증을 위해 일반 KFold로 변경
kf = KFold(n_splits=2, shuffle=True, random_state=42)
rf_model = RandomForestClassifier(n_estimators=100, random_state=42, max_depth=10, min_samples_split=5)
# KFold를 사용하여 교차 검증 실행
cv_scores = cross_val_score(rf_model, X_train, y_train, cv=kf, scoring='roc_auc')
# 교차 검증 결과 출력
print(f"교차 검증 AUC 점수: {cv_scores}")
print(f"평균 교차 검증 AUC 점수: {cv_scores.mean()}")
# 모델 훈련
rf_model.fit(X_train, y_train)
# 테스트 세트에서 성능 평가
y_pred_proba = rf_model.predict_proba(X_test)[:, 1]
roc_auc = roc_auc_score(y_test, y_pred_proba)
print(f"테스트 세트 AUC 점수: {roc_auc}")
# ROC Curve 그리기
plt.figure(figsize=(10, 6))
roc_display = RocCurveDisplay.from_estimator(rf_model, X_test, y_test)
plt.title('ROC Curve')
plt.grid(True)
# 테스트 세트에서 얻은 ROC AUC 점수 출력
plt.text(0.6, 0.2, f"Test AUC: {roc_auc:.2f}", fontsize=12, bbox=dict(facecolor='white', alpha=0.5))
plt.show()
감사합니다.
'ML' 카테고리의 다른 글
| 보안log기반 SIEM내 중요 이벤트 가중치 계산(with stats 모델) (0) | 2024.11.04 |
|---|---|
| AI로 장애 예방하기(feat. Transformer Bert) (0) | 2024.10.28 |
| 해킹 의심 IP 찾기(feat. 파이썬 통계) (0) | 2024.10.24 |
| 서버 장애 사전 감지하기(feat. 파이썬으로 통계분석) (0) | 2024.10.24 |
| 사진첩에서 원하는 이미지 찾기(feat. transformer 사용, model : ViT) (0) | 2024.10.23 |